Saturday, February 6, 2016

OpenGL rendering performance test #2 - blocks


Previous test - Procedural grass - focused on procedurally generated geometry that didn’t use any vertex data and generated meshes procedurally using only gl_VertexID value and a few lookups into shape textures, therefore with only a neglectable amount of non-procedural data fetched per instance.

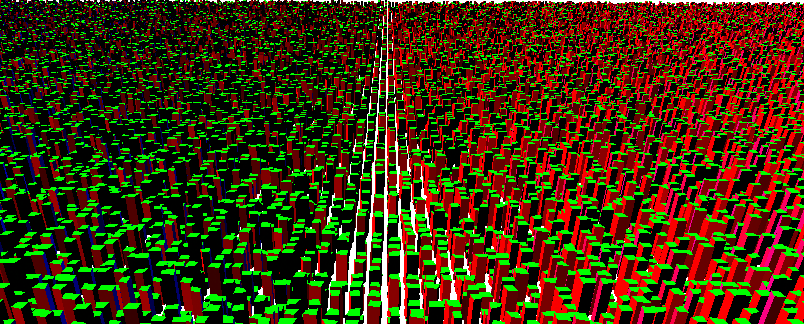
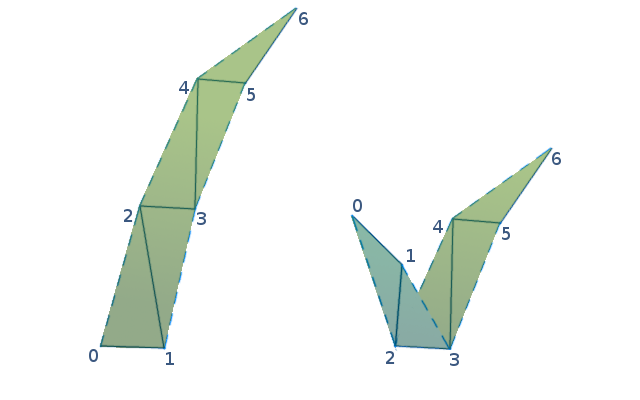
This test uses geometry generated from some per-instance data (i.e each produced vertex uses some unique data from buffers), but still partially procedurally generated. Source stream originally consisted of data extracted from OpenStreetMap maps - building footprints broken into quads, meaning there’s a constant size block of data pertaining to one rendered building block (exactly 128 bytes of data per block). Later the data were replaced with a generated content to achieve higher density for the purpose of the testing, but there’s still the same amount of data per block..

Another significant difference is that backface culling is enabled here. With grass the blades are essentially 2D and visible from both sides, and that means that the number of triangles sent to the GPU equals the number of potentially visible triangles, minus the blades that are off the frustum.

In case of the building block test there’s approximately half of the triangles culled away, being back-facing triangles of the boxes. The test measures number of triangles sent in draw calls, but for direct comparison with the grass test we’ll also use the visible triangle metrics.

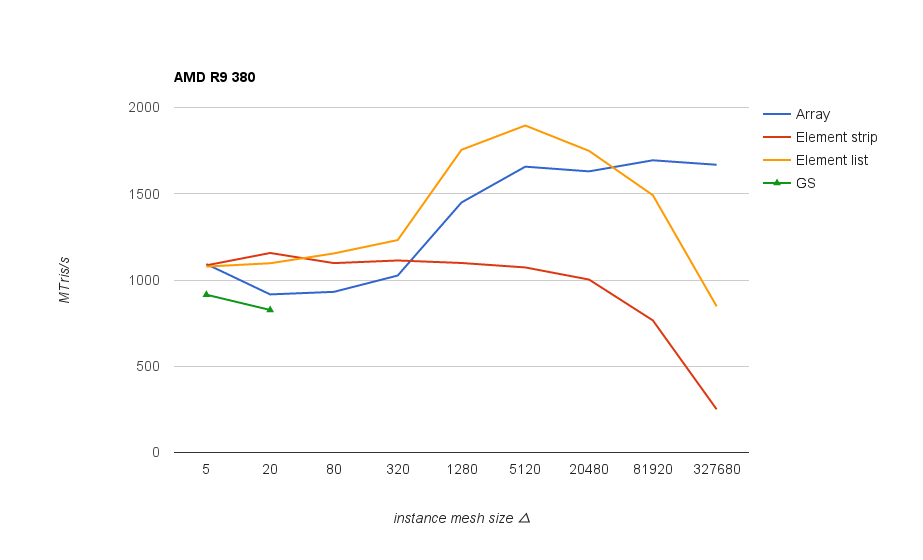
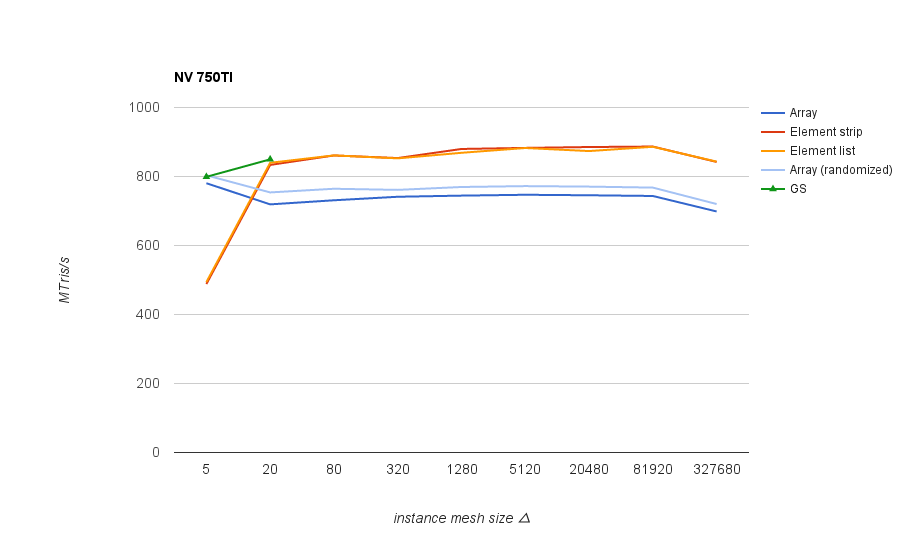
Here are the results with backface culling enabled:

bblocks.png

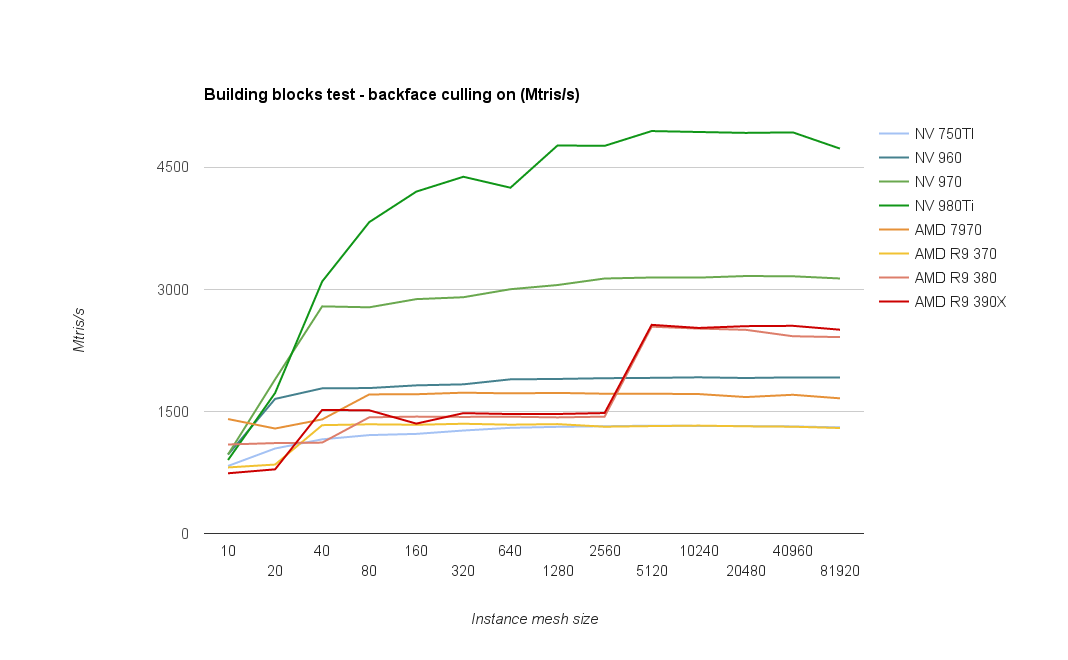
(Note this graph is missing AMD Fury cards, we’d be grateful if anyone having one of these could run the test (link at the end of the blog) and submit the results to us.)

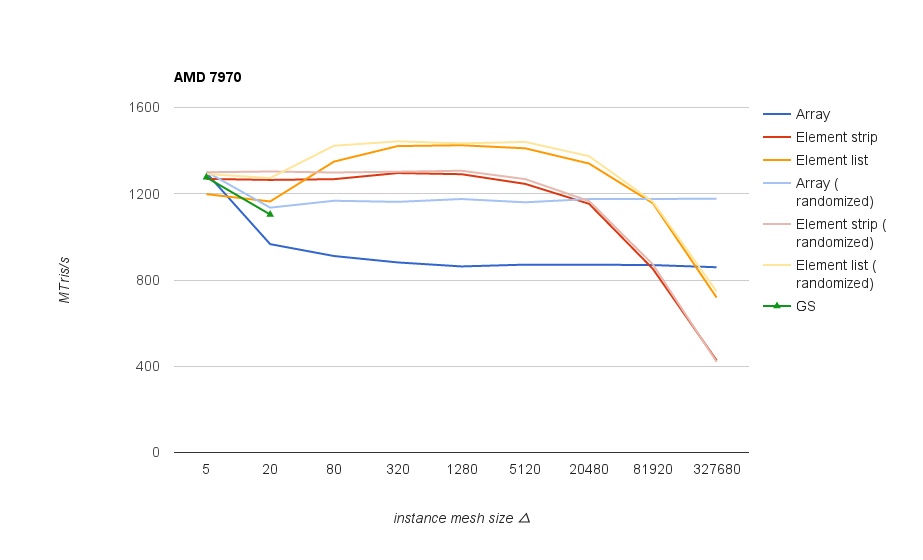
What immediately catches attention is the large boost happening on newer AMD architectures upon reaching 5k triangles per instanced draw call. A boost in that region was visible also in the grass test, though it was more gradual.
No idea what’s happening there, or rather why the performance is so low on smaller sizes. Hopefully AMD folks will be able to provide some hints.

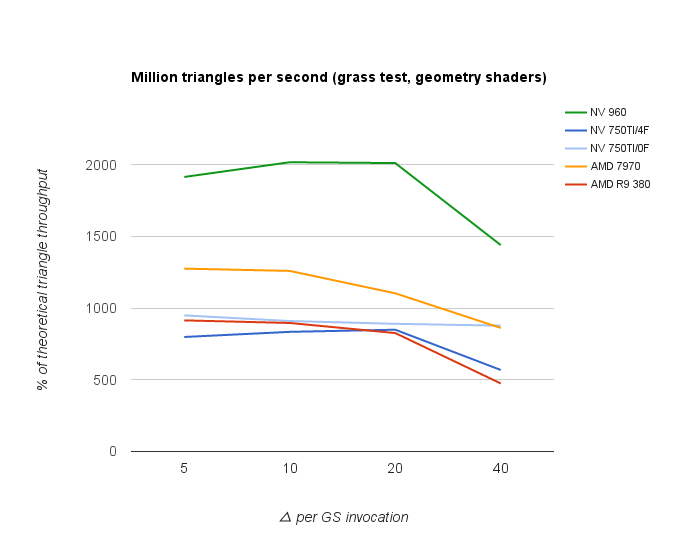
As it was visible on the grass test as well, AMD 380/390 chips perform rather poorly on the smallest meshes (less than 40 triangles), which also corresponds to the relatively poor performance of geometry shaders.

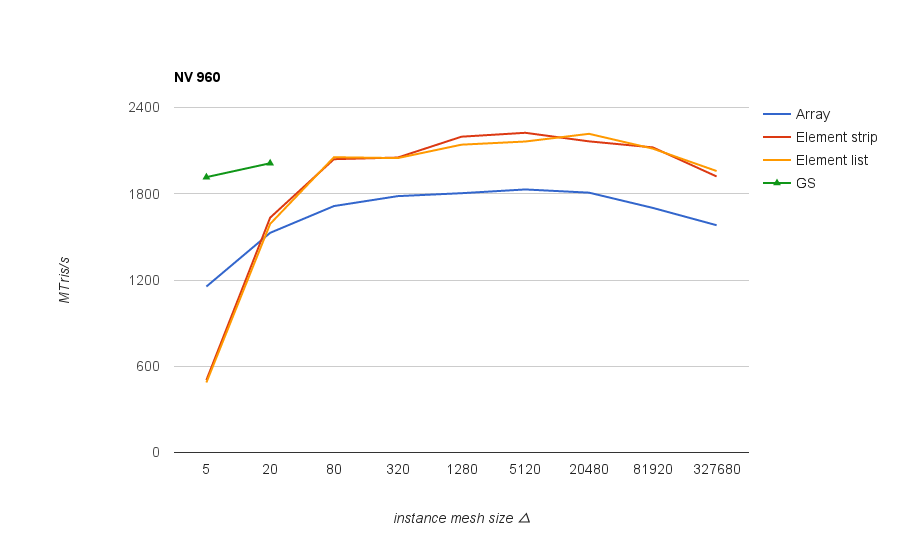
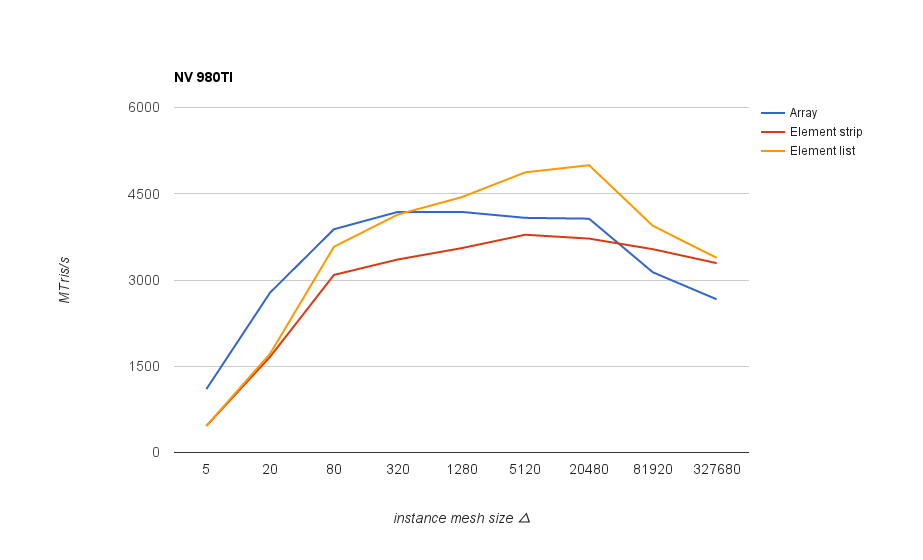
To be able to compare peak performance with the grass test we need to turn off backface culling, getting the following results:

bblockscoff.png

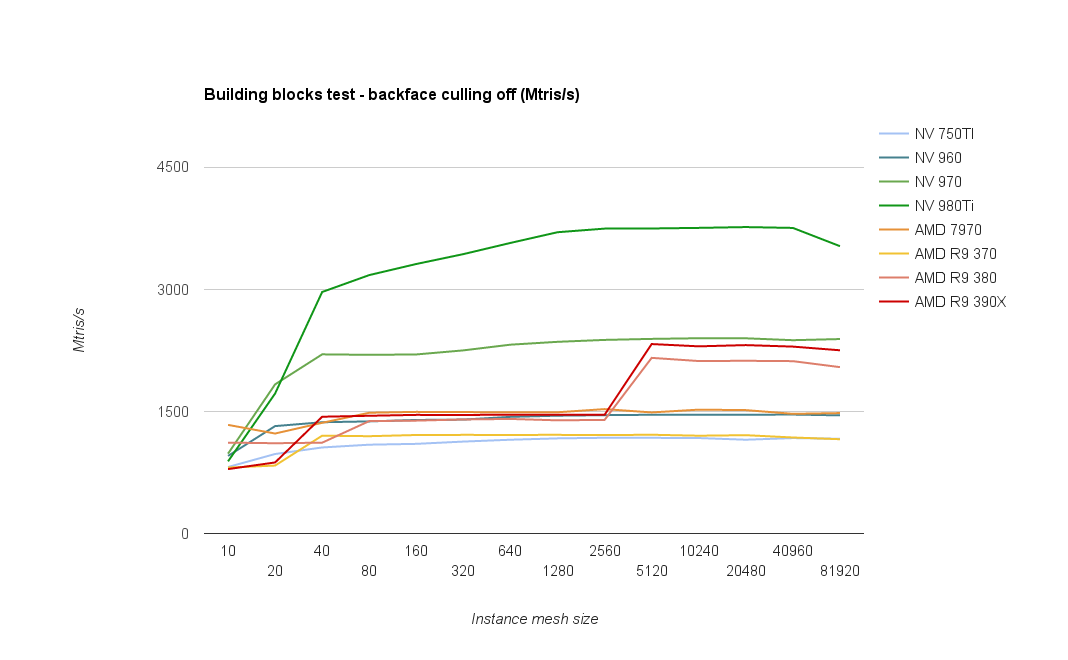
With culling off, the GPU has to render all triangles, twice as much as in previous test. It shows on Nvidia cards, taking roughly a 30% hit.
On AMD the dip is much smaller though, indicating that maybe there’s another bottleneck.

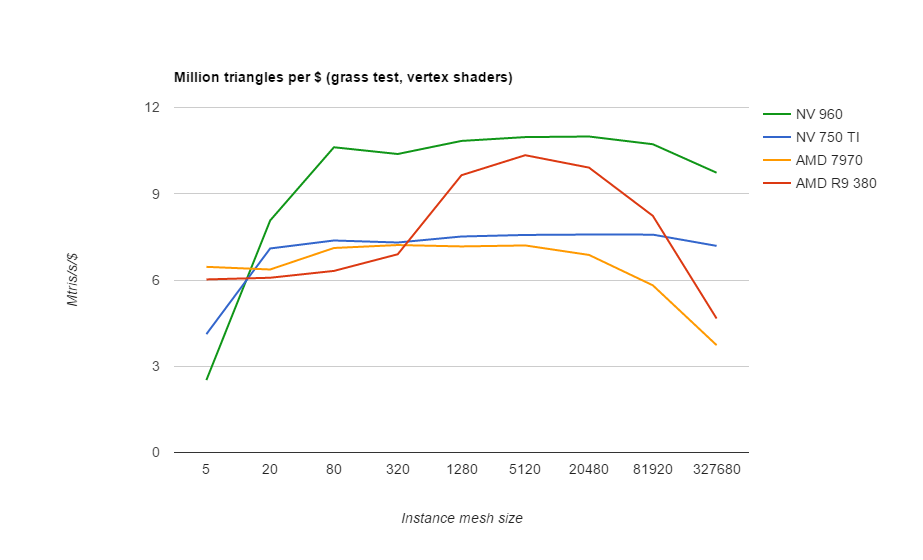
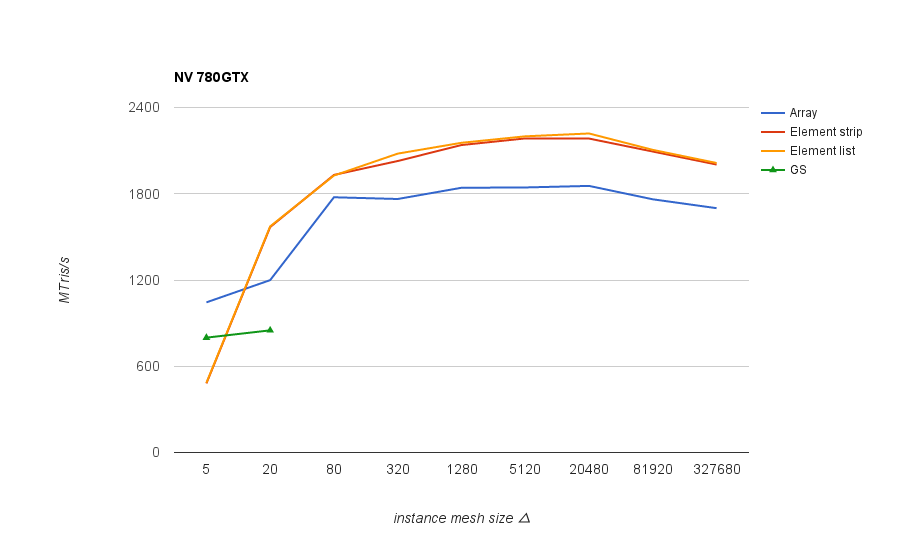
Grass test results for comparison (note slightly different instance mesh sizes). Grass test uses much less per-instance data, but has a more complex vertex shader. Apparently, it suits Nvidia cards better:

grass.png


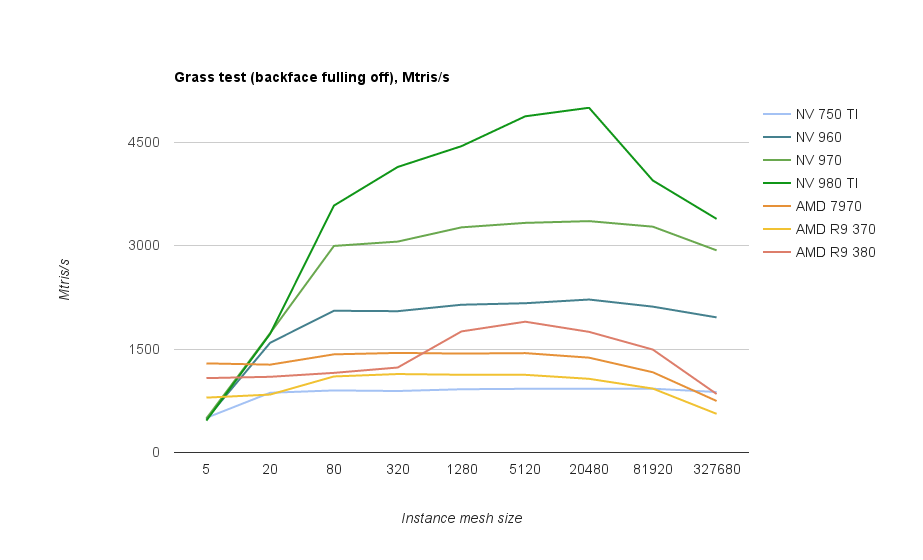
Conclusion: both vendors show the best performance when the geometry in instanced calls is grouped into 5 - 20k triangles. On AMD GCN 1.1+ chips the 5k threshold seems to be critical, with performance almost doubling.

Test sources and binaries


All tests can be found at https://github.com/hrabcak/draw_call_perf

If anyone wants to contribute their benchmark results, the binaries can be downloaded from here: Download Outerra perf test

There are 3 tests: grass, buildings and cubes. The tests can be launched by running their respective bat files. Each test run lasts only 4-5 seconds, but there are many tested combinations so the total time can be up to 15 minutes.

Once each test completes, you will be asked to submit the test results to us. The test results are stored in a CSV file, and include the GPU type, driver version and performance measurements.
We will be updating the graphs to fill the missing pieces.


Additional test results


More cards added based on test result submissions:


@cameni

Sunday, January 31, 2016

OpenGL rendering performance test #1 - Procedural grass


This is the first of several OpenGL rendering performance tests done to determine the best strategy for rendering of various type of procedural and non-procedural content.
This particular test concerns with rendering of small procedurally generated meshes and the optimal way to render them to achieve the highest triangle throughput on different hardware.

Test setup:
  • rendering a large number of individual grass blades using various rendering methods
  • a single grass blade in the test is made of 7 vertices and 5 triangles
    grass-strip.png
  • grass is organized in tiles with 256x256 blades, making 327680 effective triangles, rendered using either:
    • a single draw call rendering 327680 grass triangles at once, or
    • an instanced draw call with different instance mesh sizes and corresponding number of instances, rendering the same scene
  • rendering methods:
    • arrays via glDrawArrays / glDrawArraysInstanced, using a triangle strip with 2 extra vertices to transition from one blade to another (except for instanced draw call with a single blade per instance)
    • indexed rendering via glDrawElements / glDrawElementsInstanced, separately as a triangle strip or a triangle list, with index buffer containing indices for 1,2,4 etc up to all 65536 blades at once
    • a geometry shader (GS) producing blades from point input, optionally also generating several blades in one invocation
      GS performance showed up to be dependent on the number of interpolants used by the fragment shader, so we also tested a varying number of these
  • position of grass blades is computed from the blade coordinate within the grass tile, derived purely from gl_InstanceID and gl_VertexID values; rendering does not use any vertex attributes, it uses only small textures storing the ground and grass height, looked up using the blade coordinate
  • also tested randomizing the order in which the blades are rendered in tile, it seems to boost performance on older GPUs a bit

This test generates lots of geometry from little input data, which might be considered a distinctive property of procedural rendering.

Goals of the test are to determine the fastest rendering method for procedural geometry across different graphics cards and architectures, the optimal mesh size per (internal) draw call, the achievable triangle throughput and factors that affect it.

Results

Performance results for the same scene rendered divided into varying size instances. The best results overall were obtained with indexed triangle list rendering, shown in the following graph, measured as triangle throughput at different instance mesh sizes:

 (updated graph with some recent cards)

On Nvidia GPUs and on older AMD chips (1st gen GCN and earlier) it’s good to keep mesh size above 80 triangles in order not to lose performance significantly. On newer AMD chips the threshold seems to be much higher - above 1k, and after 20k the performance goes down again.
Unfortunately I haven’t got a Fury card here to test if this holds for the latest parts, but anyone can run the tests and submit the results to us (links at the end).

In any case, mesh size around 5k triangles is a good one that works well across different GPUs. Interestingly both vendors start to have issues at different ends - on Nvidia, performance drops with small meshes/lots of instances (increasing CPU side overhead), whereas AMD cards start having problem with larger meshes (but not with array rendering).

Conclusion: with small meshes, always group several instances into one draw call so that resulting effective mesh size is around 1 - 20k.

Geometry shader performance roughly corresponds to the performance of instanced vertex shader rendering with small instance mesh sizes, which in all cases lie below the peak performance. This also shows as a problem on newer AMD cards with disproportionally low performance with geometry shaders.
Note that there’s one factor that can still shift the disadvantage in some cases - the ability to implement culling as a fast discard in GS, especially in this test where lots of off-screen geometry can be discarded.
mtris-gs.png
GS performance is also affected by the number of interpolants (0 or 4 floats in the graph), but mainly on Nvidia cards.

The following graph shows the performance as a percentage of given card’s theoretical peak Mtris/s performance (core clock * triangles per clock of given architecture). However, the resulting numbers for AMD cards seem to be too low.

Perhaps a better comparison is the performance per dollar graph that follows after this one.


Performance per dollar, using the prices as of Dec 2015 from http://www.videocardbenchmark.net/gpu_value.html


Results for individual GPUs


Arrays are generally slower here because of 2 extra vertices needed to cross between grass blades in triangle strips, and only match the indexed rendering when using per-blade instances, where the extra vertices aren’t needed.

“Randomized” versions just reverse the bits in computed blade index to ensure that blade positions are spread. This seems to help a bit on older architectures.

AMD7970-grass.png

Unexpected performance drop on smaller meshes on newer AMD cards (380, 390X)
AMDR9_380-grass.png

Slower rendering on Nvidia with small meshes is due to sudden CPU-side overhead.
NV750Ti-grass.png
NV960-grass.png
With more powerful Nvidia GPUs it’s also best to aim for meshes larger than 1k, as elsewhere minor performance bump becomes slightly more prominent:
NV980Ti-grass.png

Older Nvidia GPUs show comparatively worse geometry shader performance than newer ones:
NV780-grass.png


Test sources and binaries


All tests can be found at https://github.com/hrabcak/draw_call_perf

If anyone wants to contribute their benchmark results, the binaries can be downloaded from here: Download Outerra perf test

There are 3 tests: grass, buildings and cubes. The tests can be launched by running their respective bat files. Each test run lasts around 4-5 seconds, but there are many tested combinations so the total time is up to 15 minutes.

Once each test completes, you will be asked to submit the test results to us. The test results are stored in a CSV file, and include the GPU type, driver version and performance measurements.
We will be updating the graphs to fill the missing pieces.

The other two tests will be described in subsequent blog posts.


@cameni